Within The Layer, there are two Sales Performance widgets, a managerial one with all team members and an individual one.
Managerial View
In the view below you can see that each team member is show against their Opportunity, Profit, Turnover and Service Statistics.
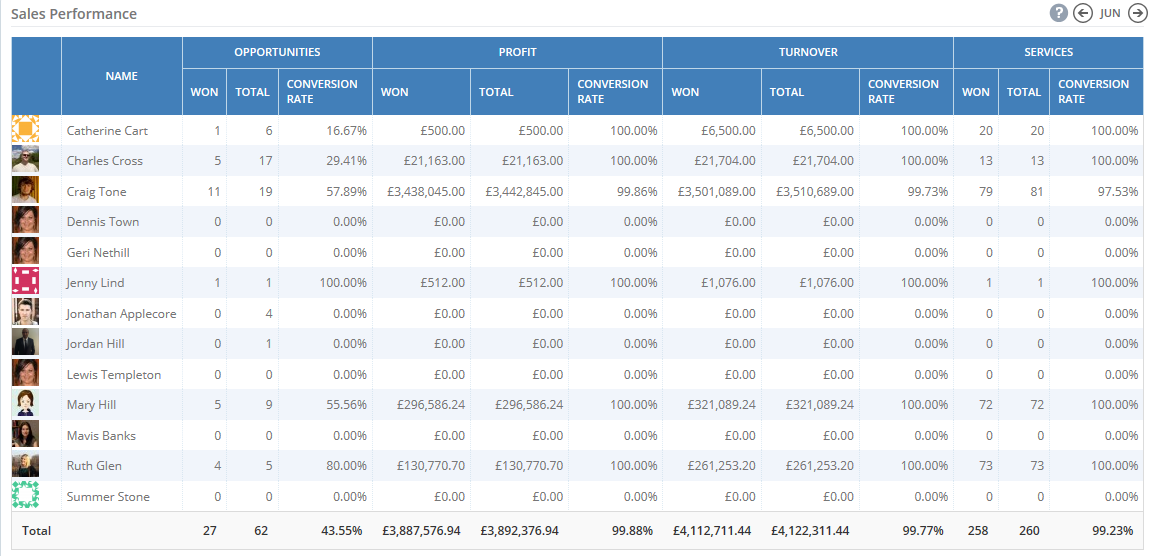
The opportunities section will show the number of won opportunities per user, their total number of opportunities and the percentage rate of won opportunities out of all opportunities.
Similarly the profit group of column shows the total profit won (at the signed quotation stage) the total profit that the users opportunities would provide (if all were won) and the conversion rate of the won profit against total proposed profit.
The turnover section shows the total turnover won (at the signed quotation stage) the total turnover that the users opportunities would provide (if all were won) and the conversion rate of the won turnover against total proposed turnover.
The Services section will display the number of won services (from the creation of the sales order), the total number of service (this could change from the quotation) and the percentage of won against total services.
The totals for all team members is also displayed along the bottom of the widget (the mean values of all percentages are shown).
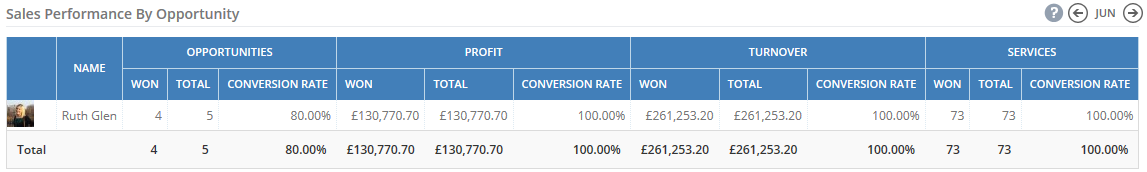
Individual View
This information is also displayed in the individual widget.